
HighCharts - 学习笔记整理
HighCharts概述:
HighCharts是用JavaScript编写的图表库,可以在Web应用中使用,开源,个人及非商可以任用。
HighCharts特点:
- 兼容性 - 支持所有主流浏览器和移动平台(android、iOS等)。
- 多设备 - 支持多种设备,如手持设备 iPhone/iPad、平板等。
- 免费使用 - 开源免费。
- 轻量 - highcharts.js 内核库大小只有 35KB 左右。
- 配置简单 - 使用 json 格式配置
- 动态 - 可以在图表生成后修改。
- 多维 - 支持多维图表
- 配置提示工具 - 鼠标移动到图表的某一点上有提示信息。
- 时间轴 - 可以精确到毫秒。
- 导出 - 表格可导出为 PDF/ PNG/ JPG / SVG 格式
- 输出 - 网页输出图表。
- 可变焦 - 选中图表部分放大,近距离观察图表;
- 外部数据 - 从服务器载入动态数据。
- 文字旋转 - 支持在任意方向的标签旋转。
HighCharts构成:
界面构成:
在Highcharts中,一个图表通常由图表区,标题,绘图区,坐标轴,图例,数据列等几个部分组成。wh
代码构成:
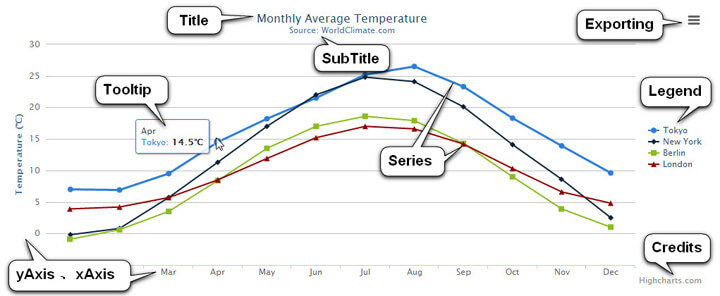
- 标题(Title):
图表标题,包含标题和副标题(subTitle),其中副标题是非必须的。
- 坐标轴(Axis):
坐标轴包含x轴(xAxis)和y轴(yAxis)。通常情况下,x轴显示在图表的底部,y轴显示在图表的左侧。多个数据列可以共同使用同一个坐标轴,为了对比或区分数据,Highcharts提供了多轴的支持。
- 数据列(Series):
数据列即图表上一个或多个数据系列,比如曲线图中的一条曲线,柱状图中的一个柱形。
- 数据提示框(Tooltip):
当鼠标悬停在某点上时,以框的形式提示该点的数据,比如该点的值、数据单位等。数据提示框内提示的信息完全可以通过格式化函数动态指定。
- 图例(Legend):
图例是图表中用不同形状、颜色、文字等 标示不同数据列,通过点击标示可以显示或隐藏该数据列。
- 版权标签(Credits):
显示在图表右下方的包含链接的文字,默认是Highcharts官网地址。通过指定credits.enabled=false即可不显示该信息。
- 导出功能(Exporting):
通过引入 exporting.js即可增加图表导出为常见文件功能。
- 示线(PlotLines):
可以在图表上增加一条标示线,比如平均值线,最高值线等。
- 示区(PlotBands):
可以在图表添加不同颜色的区域带,标示出明显的范围区域。
HighCharts配置:
HighCharts常用配置项:
| 配置项 | 说 明 |
|---|---|
| chart | 图表基本配置项 |
| colors | 全局颜色 |
| credits | 版权信息配置项 |
| data | 高级数据模块配置项 |
| defs | 定义SVG风格模式适配项 |
| drilldown | 下钻功能配置项 |
| exporting | 导出功能配置项 |
| labels | 标签配置项 |
| legend | 图例配置项 |
| loading | 加载动画配置项 |
| navigation | 导航配置项 |
| noData | 无数据模块配置项 |
| pane | 面板模块配置项 |
| plotOptions | 绘图区配置项 |
| responsive | 响应式适配配置项 |
| series | 数据列配置项 |
| subtitle | 副标题配置项 |
| title | 标题配置项 |
| tooltip | 提示框配置项 |
| xAxis | x轴配置项 |
| yAxis | y轴配置项 |
| zAxis | z轴配置项 |
HighCharts图表容器配置:
1、通过 dom 调用 highcharts() 函数的方式
$("#container").highcharts({
    // Highcharts 配置
});
2、通过 chart.renderTo 来指定
var charts = new Highcharts.Chart({
    // Highcharts 配置
    chart : {
        renderTo : "container"  // 注意这里一定是 ID 选择器
    }
});
3、通过构造函数
var charts = new Highcharts.Chart('container', {
  // Highcharts 配置
});
Highcharts图表样式配置:
图表样式属性包括 border、backgroundColor、margin、spacing、style等
边框:包括 borderColor、borderRadius、borderWidth
背景:包括 backgroundColor
外边距:包括 margin、marginTop、marginRight、marginBottom、marginLeft
内边距:包括 spacing、spacingTop、spacingRight、spacingBottom、spacingLeft
其他样式:其他属性例如字体等属性,实例代码
示例代码:
chart: {
    style: {
        fontFamily: "",
        fontSize: '12px',
        fontWeight: 'bold',
        color: '#006cee'
    }
}
另外还可以通过
chart.className来绑定 CSS 类并给定 CSS 样式。
HIghcharts图表绘图配置:
图表绘图区的可配置属性有:
- plotBackgroundColor : 绘图区背景颜色
- plotBackgroundImage : 绘图区背景图片
- plotBorderColor : 绘图区边框颜色
- plotBorderWidth : 绘图区边框宽度
- plotShadow : 绘图投影
Highcharts图表常用事件:
- click :图表点击事件,效果见 在线演示
- load :图表加载完后事件,效果见 在线演示
- addSeries :图表增加序列事件,效果见 在线演示
- drilldown :图表下钻事件,效果见 在线演示
- drillup : 图表上钻事件,效果见 在线演示
- redraw :图表重绘事件,效果见 在线演示
- selection : 图表范围选择事件,效果见 在线演示
- beforePrint : 图表打印前事件,效果见 在线演示
- afterPrint : 图表打印后事件,效果见 在线演示
Highcharts图表:
直线图 - (line):
示例代码:
<!DOCTYPE html>
<html lang="en">
<head>
    <meta charset="UTF-8">
    <title>折线图</title>
</head>
<style>
    #container{
        width: 1000px;
        height: 500px;
        margin:0 auto;
    }
</style>
<body>
<div id="container"></div>
</body>
<script src="http://cdn.hcharts.cn/highcharts/highcharts.js"></script>
<script>
    var chart = new Highcharts.Chart('container', {
        chart: {
            type: 'line',                       //指定图表的类型,默认是折线图(line)
            style: {
                fontFamily: "Microsoft YaHei",
                fontSize: '18px',
                fontWeight: 'bold'
            }
        }
        ,title: {
            text: '不同城市的月平均气温', // 标题
            x: -20   // 相对于水平对齐的偏移量,可以是负数,单位是px
        },
        subtitle: {
            text: '数据来源: xxx.com', // 副标题
            x: -20  //相对于水平对齐的偏移量,可以是负数,单位是px
        },
        xAxis: { // x轴
            categories: ['一月', '二月', '三月', '四月', '五月', '六月', '七月', '八月', '九月', '十月', '十一月', '十二月']
        },
        yAxis: { //y轴
            title: {
                text: '温度 (°C)'
            },
            plotLines: [{
                value: 0,
                width: 1,
                color: '#808080'
            }]
        },
        tooltip: {
            valueSuffix: '°C'
        },
        legend: {   // 图例配置项
            layout: 'vertical',  // horizontal" 或 "vertical
            align: 'right',   // left,center 和 right
            verticalAlign: 'middle', //  top,middle 和 bottom
            borderWidth: 0
        },
        series: [{
            name: '东京',
            data: [7.0, 6.9, 9.5, 14.5, 18.2, 21.5, 25.2, 26.5, 23.3, 18.3, 13.9, 9.6]
        }, {
            name: '纽约',
            data: [-0.2, 0.8, 5.7, 11.3, 17.0, 22.0, 24.8, 24.1, 20.1, 14.1, 8.6, 2.5]
        }, {
            name: '柏林',
            data: [-0.9, 0.6, 3.5, 8.4, 13.5, 17.0, 18.6, 17.9, 14.3, 9.0, 3.9, 1.0]
        }, {
            name: '伦敦',
            data: [3.9, 4.2, 5.7, 8.5, 11.9, 15.2, 17.0, 16.6, 14.2, 10.3, 6.6, 4.8]
        }]
    });

</script>
</html>
曲线图 - (spline):
示例代码:
<!DOCTYPE html>
<html lang="en">
<head>
    <meta charset="UTF-8">
    <title>曲线图</title>
</head>
<style>
#container{
    width: 1200px;
    height: 600px;
    margin:0 auto;
}

</style>
<body>
<div id="container"></div>
</body>
<script src="http://cdn.hcharts.cn/highcharts/highcharts.js"></script>
<script>
    var charts =new  Highcharts.Chart('container',{
        chart:{ // 图表类型
            type:'spline'
        },
        title:{ // 标题
            text:'城市平均气温-曲线图'
        },
        subtitle:{ //副标题
            text:'东京,纽约,伦敦'
        },
        xAlias:{  // x轴
            categories: ['一月', '二月', '三月', '四月', '五月', '六月',
                '七月', '八月', '九月', '十月', '十一月', '十二月']
        },
        yAlias:{ // y轴
            title: {
                enable:true,
                text: 'Temperature (\xB0C)'
            },
            plotLines: [{
                value: 0,
                width: 1,
                color: '#808080'
            }]
        },
        legend:{
            layout: 'vertical',
            align: 'right',
            verticalAlign: 'middle',
            borderWidth: 0
        },
        tooltip:{
            valueSuffix: '\xB0C',
            crosshairs: true,//竖线
            shared: true
        },
        plotOptions:{
            spline: {
                marker: {
                    radius: 4,
                    lineColor: '#666666',
                    lineWidth: 1
                }
            }
        },
        series:[
            {
                name: 'Tokyo',
                data: [7.0, 6.9, 9.5, 14.5, 18.2, 21.5, 25.2,
                    26.5, 23.3, 18.3, 13.9, 9.6]
            },
            {
                name: 'New York',
                data: [-0.2, 0.8, 5.7, 11.3, 17.0, 22.0, 24.8,
                    24.1, 20.1, 14.1, 8.6, 2.5]
            },
            {
                name: 'London',
                data: [3.9, 4.2, 5.7, 8.5, 11.9, 15.2, 17.0,
                    16.6, 14.2, 10.3, 6.6, 4.8]
            }
        ]
    });
</script>
</html>
面积图 - (area):
示例代码:
<!DOCTYPE html>
<html lang="en">
<head>
    <meta charset="UTF-8">
    <title>面积图</title>
</head>
<style>
    #container {
        width: 1000px;
        height: 500px;
        margin: 0 auto;
    }
</style>
<body>
<div id="container"></div>
</body>
<script src="http://cdn.hcharts.cn/highcharts/highcharts.js"></script>
<script>

    var chat = new Highcharts.Chart('container', {
        chart: {
            type: 'area'
        },
        title: {
            text: '面积图'
        },
        subtitle: {
            text: '一个简单的面积图'
        },
        xAlias: {
            //allowDecimals: true,
            title:{
                text:'Y轴',
                categories: ['一月', '二月', '三月', '四月', '五月', '六月', '七月', '八月', '九月', '十月']
            }
        },
        tooltip: {
            valueSuffix: '单位'
        },
        legend: {
            layout: 'vertical',
            align: 'right',
            verticalAlign: 'middle',
            borderWidth: 0
        },
        yAlias: {
            title: {
                text: 'Y轴'
            },plotLines: [{
                value: 0,
                width: 1,
                color: '#808080'
            }]
        },
        series: [
            {
                name: '列一',
                data: [13, 83, 56, 32, 89, 97, 143, 45, 67, 87, 98]
            },
            {
                name: '列二',
                data: [13, 23, 61, 62, 15, 27, 83, 75, 47, 17, 28]
            }]


    });


</script>
</html>
曲线面积图 - (areaspline):
示例代码:
<!DOCTYPE html>
<html lang="en">
<head>
    <meta charset="UTF-8">
    <title>曲线面积图</title>
</head>
<style>
    #container{
        width: 1200px;
        height: 600px;
        margin:0 auto;
    }

</style>
<body>
<div id="container"></div>
</body>
<script src="http://cdn.hcharts.cn/highcharts/highcharts.js"></script>
<script>
    var charts =new  Highcharts.Chart('container',{
        chart: {
            type: 'areaspline'
        },
        title: {
            text: '不同家庭一周水果消费情况'
        },
        legend: {
            layout: 'vertical',
            align: 'left',
            verticalAlign: 'top',
            x: 150,
            y: 100,
            floating: true,
            borderWidth: 1,
            backgroundColor: (Highcharts.theme && Highcharts.theme.legendBackgroundColor) || '#FFFFFF'
        },
        xAxis: {
            categories: [
                '周一',
                '周二',
                '周三',
                '周四',
                '周五',
                '周六',
                '周日'
            ],
            plotBands: [{ // visualize the weekend
                from: 4.5,
                to: 6.5,
                color: 'rgba(68, 170, 213, .2)'
            }]
        },
        yAxis: {
            title: {
                text: '水果 单位'
            }
        },
        tooltip: {
            shared: true,
            valueSuffix: ' 单位'
        },
        credits: {
            enabled: false
        },
        plotOptions: {
            areaspline: {
                fillOpacity: 0.5
            }
        },
        series: [{
            name: '甲',
            data: [3, 4, 3, 5, 4, 10, 12]
        }, {
            name: '乙',
            data: [1, 3, 4, 3, 3, 5, 4]
        }]
    });
</script>
</html>
柱状图 - (column):
示例代码:
<!DOCTYPE html>
<html lang="en">
<head>
    <meta charset="UTF-8">
    <title>柱状图</title>
</head>
<style>
    #container{
        width: 1200px;
        height: 600px;
        margin:0 auto;
    }

</style>
<body>
<div id="container"></div>
</body>
<script src="http://cdn.hcharts.cn/highcharts/highcharts.js"></script>
<script>
    var charts =new  Highcharts.Chart('container',{
        chart: {
            type: 'column'
        },
        title: {
            text: '堆叠柱形图'
        },
        xAxis: {
            categories: ['苹果', '橘子', '梨', '葡萄', '香蕉']
        },
        yAxis: {
            min: 0,
            title: {
                text: '水果消费总量'
            },
            stackLabels: {
                enabled: true,
                style: {
                    fontWeight: 'bold',
                    color: 'gray'
                }
            }
        },
        legend: {
            align: 'right',
            x: -30,
            verticalAlign: 'top',
            y: 25,
            floating: true,
            backgroundColor:  'white',
            borderColor: '#CCC',
            borderWidth: 1,
            shadow: false
        },
        tooltip: {
            formatter: function () {
                return '<b>' + this.x + '</b><br/>' +
                    this.series.name + ': ' + this.y + '<br/>' +
                    '总量: ' + this.point.stackTotal;
            }
        },
        plotOptions: {
            column: {
                stacking: 'normal',
                dataLabels: {
                    enabled: true,
                    color:  '#FFF',
                    style: {
                        textShadow: '0 0 3px black'
                    }
                }
            }
        },
        series: [{
            name: '甲',
            data: [5, 3, 4, 7, 2]
        }, {
            name: '乙',
            data: [2, 2, 3, 2, 1]
        }, {
            name: '丙',
            data: [3, 4, 4, 2, 5]
        }]
    });
</script>
</html>
条形图 - (bar):
示例代码:
<!DOCTYPE html>
<html lang="en">
<head>
    <meta charset="UTF-8">
    <title>条形图</title>
</head>
<style>
    #container{
        width: 1200px;
        height: 600px;
        margin:0 auto;
    }

</style>
<body>
<div id="container"></div>
</body>
<script src="http://cdn.hcharts.cn/highcharts/highcharts.js"></script>
<script>
    var charts =new  Highcharts.Chart('container',{
        chart: {
            type: 'bar'
        },
        title: {
            text: '各洲不同时间的人口条形图'
        },
        subtitle: {
            text: '数据来源: Wikipedia.org'
        },
        xAxis: {
            categories: ['非洲', '美洲', '亚洲', '欧洲', '大洋洲'],
            title: {
                text: null
            }
        },
        yAxis: {
            min: 0,
            title: {
                text: '人口总量 (百万)',
                align: 'high'
            },
            labels: {
                overflow: 'justify'
            }
        },
        tooltip: {
            valueSuffix: ' 百万'
        },
        plotOptions: {
            bar: {
                dataLabels: {
                    enabled: true,
                    allowOverlap: true
                }
            }
        },
        legend: {
            layout: 'vertical',
            align: 'right',
            verticalAlign: 'top',
            x: -40,
            y: 100,
            floating: true,
            borderWidth: 1,
            backgroundColor: '#FFFFFF',
            shadow: true
        },
        credits: {
            enabled: false
        },
        series: [{
            name: '1800 年',
            data: [107, 31, 635, 203, 2]
        }, {
            name: '1900 年',
            data: [133, 156, 947, 408, 6]
        }, {
            name: '2008 年',
            data: [973, 914, 4054, 732, 34]
        }]
    });
</script>
</html>
饼图 - (pie):
示例代码:
<!DOCTYPE html>
<html lang="en">
<head>
    <meta charset="UTF-8">
    <title>饼图</title>
</head>
<style>
    #container{
        width: 1200px;
        height: 600px;
        margin:0 auto;
    }

</style>
<body>
<div id="container"></div>
</body>
<script src="http://cdn.hcharts.cn/highcharts/highcharts.js"></script>
<script>
    var charts =new  Highcharts.Chart('container',{
        chart: {
            plotBackgroundColor: null,
            plotBorderWidth: null,
            plotShadow: false
        },
        title: {
            text: '2014 某网站各浏览器浏览量占比'
        },
        tooltip: {
            headerFormat: '{series.name}<br>',
            pointFormat: '{point.name}: <b>{point.percentage:.1f}%</b>'
        },
        plotOptions: {
            pie: {
                allowPointSelect: true,
                cursor: 'pointer',
                dataLabels: {
                    enabled: true,
                    format: '<b>{point.name}</b>: {point.percentage:.1f} %',
                    style: {
                        color:'black'
                    }
                }
            }
        },
        series: [{
            type: 'pie',
            name: '浏览器访问量占比',
            data: [
                ['Firefox',   45.0],
                ['IE',       26.8],
                {
                    name: 'Chrome',
                    y: 12.8,
                    sliced: true,
                    selected: true
                },
                ['Safari',    8.5],
                ['Opera',     6.2],
                ['其他',   0.7]
            ]
        }]
    });
</script>
</html>
散点图 - (scatter):
示例代码:
<!DOCTYPE html>
<html lang="en">
<head>
    <meta charset="UTF-8">
    <title>散点图</title>
</head>
<style>
    #container{
        width: 1200px;
        height: 600px;
        margin:0 auto;
    }

</style>
<body>
<div id="container"></div>
</body>
<script src="http://cdn.hcharts.cn/highcharts/highcharts.js"></script>
<script>
    var charts =new  Highcharts.Chart('container',{

        chart: {
            type: 'scatter',
            zoomType: 'xy'
        },
        title: {
            text: '507 人按性别划分的身高和体重分布图'
        },
        subtitle: {
            text: '数据来源: Heinz  2003'
        },
        xAxis: {
            title: {
                enabled: true,
                text: '身高 (cm)'
            },
            startOnTick: true,
            endOnTick: true,
            showLastLabel: true
        },
        yAxis: {
            title: {
                text: '体重 (kg)'
            }
        },
        legend: {
            layout: 'vertical',
            align: 'left',
            verticalAlign: 'top',
            x: 100,
            y: 70,
            floating: true,
            backgroundColor: '#FFFFFF',
            borderWidth: 1
        },
        plotOptions: {
            scatter: {
                marker: {
                    radius: 5,
                    states: {
                        hover: {
                            enabled: true,
                            lineColor: 'rgb(100,100,100)'
                        }
                    }
                },
                states: {
                    hover: {
                        marker: {
                            enabled: false
                        }
                    }
                },
                tooltip: {
                    headerFormat: '<b>{series.name}</b><br>',
                    pointFormat: '{point.x} cm, {point.y} kg'
                }
            }
        },
        series: [{
            name: '女',
            color: 'rgba(223, 83, 83, .5)',
            data: [[161.2, 51.6], [167.5, 59.0], [159.5, 49.2], [157.0, 63.0], [155.8, 53.6],
                [170.0, 59.0], [159.1, 47.6], [166.0, 69.8], [176.2, 66.8], [160.2, 75.2],
                [172.5, 55.2], [170.9, 54.2], [172.9, 62.5], [153.4, 42.0], [160.0, 50.0],
                [147.2, 49.8], [168.2, 49.2], [175.0, 73.2], [157.0, 47.8], [167.6, 68.8],
                [159.5, 50.6], [175.0, 82.5], [166.8, 57.2], [176.5, 87.8], [170.2, 72.8],
                [174.0, 54.5], [173.0, 59.8], [179.9, 67.3], [170.5, 67.8], [160.0, 47.0],
                [154.4, 46.2], [162.0, 55.0], [176.5, 83.0], [160.0, 54.4], [152.0, 45.8],
                [162.1, 53.6], [170.0, 73.2], [160.2, 52.1], [161.3, 67.9], [166.4, 56.6],
                [168.9, 62.3], [163.8, 58.5], [167.6, 54.5], [160.0, 50.2], [161.3, 60.3],
                [167.6, 58.3], [165.1, 56.2], [160.0, 50.2], [170.0, 72.9], [157.5, 59.8],
                [167.6, 61.0], [160.7, 69.1], [163.2, 55.9], [152.4, 46.5], [157.5, 54.3],
                [168.3, 54.8], [180.3, 60.7], [165.5, 60.0], [165.0, 62.0], [164.5, 60.3],
                [156.0, 52.7], [160.0, 74.3], [163.0, 62.0], [165.7, 73.1], [161.0, 80.0],
                [162.0, 54.7], [166.0, 53.2], [174.0, 75.7], [172.7, 61.1], [167.6, 55.7],
                [151.1, 48.7], [164.5, 52.3], [163.5, 50.0], [152.0, 59.3], [169.0, 62.5],
                [164.0, 55.7], [161.2, 54.8], [155.0, 45.9], [170.0, 70.6], [176.2, 67.2],
                [170.0, 69.4], [162.5, 58.2], [170.3, 64.8], [164.1, 71.6], [169.5, 52.8],
                [163.2, 59.8], [154.5, 49.0], [159.8, 50.0], [173.2, 69.2], [170.0, 55.9],
                [161.4, 63.4], [169.0, 58.2], [166.2, 58.6], [159.4, 45.7], [162.5, 52.2],
                [159.0, 48.6], [162.8, 57.8], [159.0, 55.6], [179.8, 66.8], [162.9, 59.4],
                [161.0, 53.6], [151.1, 73.2], [168.2, 53.4], [168.9, 69.0], [173.2, 58.4],
                [171.8, 56.2], [178.0, 70.6], [164.3, 59.8], [163.0, 72.0], [168.5, 65.2],
                [166.8, 56.6], [172.7, 105.2], [163.5, 51.8], [169.4, 63.4], [167.8, 59.0],
                [159.5, 47.6], [167.6, 63.0], [161.2, 55.2], [160.0, 45.0], [163.2, 54.0],
                [162.2, 50.2], [161.3, 60.2], [149.5, 44.8], [157.5, 58.8], [163.2, 56.4],
                [172.7, 62.0], [155.0, 49.2], [156.5, 67.2], [164.0, 53.8], [160.9, 54.4],
                [162.8, 58.0], [167.0, 59.8], [160.0, 54.8], [160.0, 43.2], [168.9, 60.5],
                [158.2, 46.4], [156.0, 64.4], [160.0, 48.8], [167.1, 62.2], [158.0, 55.5],
                [167.6, 57.8], [156.0, 54.6], [162.1, 59.2], [173.4, 52.7], [159.8, 53.2],
                [170.5, 64.5], [159.2, 51.8], [157.5, 56.0], [161.3, 63.6], [162.6, 63.2],
                [160.0, 59.5], [168.9, 56.8], [165.1, 64.1], [162.6, 50.0], [165.1, 72.3],
                [166.4, 55.0], [160.0, 55.9], [152.4, 60.4], [170.2, 69.1], [162.6, 84.5],
                [170.2, 55.9], [158.8, 55.5], [172.7, 69.5], [167.6, 76.4], [162.6, 61.4],
                [167.6, 65.9], [156.2, 58.6], [175.2, 66.8], [172.1, 56.6], [162.6, 58.6],
                [160.0, 55.9], [165.1, 59.1], [182.9, 81.8], [166.4, 70.7], [165.1, 56.8],
                [177.8, 60.0], [165.1, 58.2], [175.3, 72.7], [154.9, 54.1], [158.8, 49.1],
                [172.7, 75.9], [168.9, 55.0], [161.3, 57.3], [167.6, 55.0], [165.1, 65.5],
                [175.3, 65.5], [157.5, 48.6], [163.8, 58.6], [167.6, 63.6], [165.1, 55.2],
                [165.1, 62.7], [168.9, 56.6], [162.6, 53.9], [164.5, 63.2], [176.5, 73.6],
                [168.9, 62.0], [175.3, 63.6], [159.4, 53.2], [160.0, 53.4], [170.2, 55.0],
                [162.6, 70.5], [167.6, 54.5], [162.6, 54.5], [160.7, 55.9], [160.0, 59.0],
                [157.5, 63.6], [162.6, 54.5], [152.4, 47.3], [170.2, 67.7], [165.1, 80.9],
                [172.7, 70.5], [165.1, 60.9], [170.2, 63.6], [170.2, 54.5], [170.2, 59.1],
                [161.3, 70.5], [167.6, 52.7], [167.6, 62.7], [165.1, 86.3], [162.6, 66.4],
                [152.4, 67.3], [168.9, 63.0], [170.2, 73.6], [175.2, 62.3], [175.2, 57.7],
                [160.0, 55.4], [165.1, 104.1], [174.0, 55.5], [170.2, 77.3], [160.0, 80.5],
                [167.6, 64.5], [167.6, 72.3], [167.6, 61.4], [154.9, 58.2], [162.6, 81.8],
                [175.3, 63.6], [171.4, 53.4], [157.5, 54.5], [165.1, 53.6], [160.0, 60.0],
                [174.0, 73.6], [162.6, 61.4], [174.0, 55.5], [162.6, 63.6], [161.3, 60.9],
                [156.2, 60.0], [149.9, 46.8], [169.5, 57.3], [160.0, 64.1], [175.3, 63.6],
                [169.5, 67.3], [160.0, 75.5], [172.7, 68.2], [162.6, 61.4], [157.5, 76.8],
                [176.5, 71.8], [164.4, 55.5], [160.7, 48.6], [174.0, 66.4], [163.8, 67.3]]
        }, {
            name: '男',
            color: 'rgba(119, 152, 191, .5)',
            data: [[174.0, 65.6], [175.3, 71.8], [193.5, 80.7], [186.5, 72.6], [187.2, 78.8],
                [181.5, 74.8], [184.0, 86.4], [184.5, 78.4], [175.0, 62.0], [184.0, 81.6],
                [180.0, 76.6], [177.8, 83.6], [192.0, 90.0], [176.0, 74.6], [174.0, 71.0],
                [184.0, 79.6], [192.7, 93.8], [171.5, 70.0], [173.0, 72.4], [176.0, 85.9],
                [176.0, 78.8], [180.5, 77.8], [172.7, 66.2], [176.0, 86.4], [173.5, 81.8],
                [178.0, 89.6], [180.3, 82.8], [180.3, 76.4], [164.5, 63.2], [173.0, 60.9],
                [183.5, 74.8], [175.5, 70.0], [188.0, 72.4], [189.2, 84.1], [172.8, 69.1],
                [170.0, 59.5], [182.0, 67.2], [170.0, 61.3], [177.8, 68.6], [184.2, 80.1],
                [186.7, 87.8], [171.4, 84.7], [172.7, 73.4], [175.3, 72.1], [180.3, 82.6],
                [182.9, 88.7], [188.0, 84.1], [177.2, 94.1], [172.1, 74.9], [167.0, 59.1],
                [169.5, 75.6], [174.0, 86.2], [172.7, 75.3], [182.2, 87.1], [164.1, 55.2],
                [163.0, 57.0], [171.5, 61.4], [184.2, 76.8], [174.0, 86.8], [174.0, 72.2],
                [177.0, 71.6], [186.0, 84.8], [167.0, 68.2], [171.8, 66.1], [182.0, 72.0],
                [167.0, 64.6], [177.8, 74.8], [164.5, 70.0], [192.0, 101.6], [175.5, 63.2],
                [171.2, 79.1], [181.6, 78.9], [167.4, 67.7], [181.1, 66.0], [177.0, 68.2],
                [174.5, 63.9], [177.5, 72.0], [170.5, 56.8], [182.4, 74.5], [197.1, 90.9],
                [180.1, 93.0], [175.5, 80.9], [180.6, 72.7], [184.4, 68.0], [175.5, 70.9],
                [180.6, 72.5], [177.0, 72.5], [177.1, 83.4], [181.6, 75.5], [176.5, 73.0],
                [175.0, 70.2], [174.0, 73.4], [165.1, 70.5], [177.0, 68.9], [192.0, 102.3],
                [176.5, 68.4], [169.4, 65.9], [182.1, 75.7], [179.8, 84.5], [175.3, 87.7],
                [184.9, 86.4], [177.3, 73.2], [167.4, 53.9], [178.1, 72.0], [168.9, 55.5],
                [157.2, 58.4], [180.3, 83.2], [170.2, 72.7], [177.8, 64.1], [172.7, 72.3],
                [165.1, 65.0], [186.7, 86.4], [165.1, 65.0], [174.0, 88.6], [175.3, 84.1],
                [185.4, 66.8], [177.8, 75.5], [180.3, 93.2], [180.3, 82.7], [177.8, 58.0],
                [177.8, 79.5], [177.8, 78.6], [177.8, 71.8], [177.8, 116.4], [163.8, 72.2],
                [188.0, 83.6], [198.1, 85.5], [175.3, 90.9], [166.4, 85.9], [190.5, 89.1],
                [166.4, 75.0], [177.8, 77.7], [179.7, 86.4], [172.7, 90.9], [190.5, 73.6],
                [185.4, 76.4], [168.9, 69.1], [167.6, 84.5], [175.3, 64.5], [170.2, 69.1],
                [190.5, 108.6], [177.8, 86.4], [190.5, 80.9], [177.8, 87.7], [184.2, 94.5],
                [176.5, 80.2], [177.8, 72.0], [180.3, 71.4], [171.4, 72.7], [172.7, 84.1],
                [172.7, 76.8], [177.8, 63.6], [177.8, 80.9], [182.9, 80.9], [170.2, 85.5],
                [167.6, 68.6], [175.3, 67.7], [165.1, 66.4], [185.4, 102.3], [181.6, 70.5],
                [172.7, 95.9], [190.5, 84.1], [179.1, 87.3], [175.3, 71.8], [170.2, 65.9],
                [193.0, 95.9], [171.4, 91.4], [177.8, 81.8], [177.8, 96.8], [167.6, 69.1],
                [167.6, 82.7], [180.3, 75.5], [182.9, 79.5], [176.5, 73.6], [186.7, 91.8],
                [188.0, 84.1], [188.0, 85.9], [177.8, 81.8], [174.0, 82.5], [177.8, 80.5],
                [171.4, 70.0], [185.4, 81.8], [185.4, 84.1], [188.0, 90.5], [188.0, 91.4],
                [182.9, 89.1], [176.5, 85.0], [175.3, 69.1], [175.3, 73.6], [188.0, 80.5],
                [188.0, 82.7], [175.3, 86.4], [170.5, 67.7], [179.1, 92.7], [177.8, 93.6],
                [175.3, 70.9], [182.9, 75.0], [170.8, 93.2], [188.0, 93.2], [180.3, 77.7],
                [177.8, 61.4], [185.4, 94.1], [168.9, 75.0], [185.4, 83.6], [180.3, 85.5],
                [174.0, 73.9], [167.6, 66.8], [182.9, 87.3], [160.0, 72.3], [180.3, 88.6],
                [167.6, 75.5], [186.7, 101.4], [175.3, 91.1], [175.3, 67.3], [175.9, 77.7],
                [175.3, 81.8], [179.1, 75.5], [181.6, 84.5], [177.8, 76.6], [182.9, 85.0],
                [177.8, 102.5], [184.2, 77.3], [179.1, 71.8], [176.5, 87.9], [188.0, 94.3],
                [174.0, 70.9], [167.6, 64.5], [170.2, 77.3], [167.6, 72.3], [188.0, 87.3],
                [174.0, 80.0], [176.5, 82.3], [180.3, 73.6], [167.6, 74.1], [188.0, 85.9],
                [180.3, 73.2], [167.6, 76.3], [183.0, 65.9], [183.0, 90.9], [179.1, 89.1],
                [170.2, 62.3], [177.8, 82.7], [179.1, 79.1], [190.5, 98.2], [177.8, 84.1],
                [180.3, 83.2], [180.3, 83.2]]
        }]

    });
</script>
</html>
箱线图 - (boxplot):
示例代码:
<!DOCTYPE html>
<html lang="en">
<head>
    <meta charset="UTF-8">
    <title>箱线图</title>
</head>
<style>
    #container{
        width: 1200px;
        height: 600px;
        margin:0 auto;
    }

</style>
<body>
<div id="container"></div>
</body>
<script src="http://cdn.hcharts.cn/highcharts/highcharts.js"></script>
<script src="https://img.hcharts.cn/highcharts/highcharts-more.js"></script>
<script>
    var charts =new Highcharts.Chart('container',{
        chart: {
            type: 'boxplot'
        },
        title: {
            text: 'Highcharts 箱线图'
        },
        legend: {
            enabled: false
        },
        xAxis: {
            categories: ['1', '2', '3', '4', '5'],
            title: {
                text: ''
            }
        },
        yAxis: {
            title: {
                text: '观测值'
            },
            plotLines: [{
                value: 932,
                color: 'red',
                width: 1,
                label: {
                    text: '理论模型: 932',
                    align: 'center',
                    style: {
                        color: 'gray'
                    }
                }
            }]
        },
        tooltip: {
            pointFormat: '<span style="color:{point.color}">\u25CF</span> <b> {series.name}</b><br/>' + // eslint-disable-line no-dupe-keys
            '最大值: {point.high}<br/>' +
            'Q2\t: {point.q3}<br/>' +
            '中位数: {point.median}<br/>' +
            'Q1\t: {point.q1}<br/>' +
            '最小值: {point.low}<br/>'
        },
        series: [{
            name: '观测值',
            data: [
                [760, 801, 848, 895, 965],
                [733, 853, 939, 980, 1080],
                [714, 762, 817, 870, 918],
                [724, 802, 806, 871, 950],
                [834, 836, 864, 882, 910]
            ],
            tooltip: {
                headerFormat: '<em>实验号码: {point.key}</em><br/>'
            }
        }, {
            name: '异常值',
            color: Highcharts.getOptions().colors[0],
            type: 'scatter',
            data: [ // x, y positions where 0 is the first category
                [0, 644],
                [4, 718],
                [4, 951],
                [4, 969]
            ],
            marker: {
                fillColor: 'white',
                lineWidth: 1,
                lineColor: Highcharts.getOptions().colors[0]
            },
            tooltip: {
                pointFormat: 'Observation: {point.y}'
            }
        }]
    });
</script>
</html>
气泡图 - (bubble):
示例代码:
<!DOCTYPE html>
<html lang="en">
<head>
    <meta charset="UTF-8">
    <title>气泡图</title>
</head>
<style>
    #container{
        width: 1200px;
        height: 600px;
        margin:0 auto;
    }

</style>
<body>
<div id="container"></div>
</body>
<script src="http://cdn.hcharts.cn/highcharts/highcharts.js"></script>
<script src="https://img.hcharts.cn/highcharts/highcharts-more.js"></script>
<script>
    var charts =new Highcharts.Chart('container',{
        chart: {
            type: 'bubble',
            zoomType: 'xy'
        },
        title: {
            text: 'Highcharts 气泡图'
        },
        series: [{
            name:'数据列 1',
            // 每个气泡包含三个值,x,y,z;其中 x,y用于定位,z 用于计算气泡大小
            data: [[97, 36, 79], [94, 74, 60], [68, 76, 58], [64, 87, 56], [68, 27, 73], [74, 99, 42], [7, 93, 87], [51, 69, 40], [38, 23, 33], [57, 86, 31]]
        }, {
            name:'数据列 2',
            data: [[25, 10, 87], [2, 75, 59], [11, 54, 8], [86, 55, 93], [5, 3, 58], [90, 63, 44], [91, 33, 17], [97, 3, 56], [15, 67, 48], [54, 25, 81]]
        }, {
            name:'数据列 3',
            data: [[47, 47, 21], [20, 12, 4], [6, 76, 91], [38, 30, 60], [57, 98, 64], [61, 17, 80], [83, 60, 13], [67, 78, 75], [64, 12, 10], [30, 77, 82]]
        }]
    });
</script>
</html>
误差线图 - (errorbar):
示例代码:
<!DOCTYPE html>
<html lang="en">
<head>
    <meta charset="UTF-8">
    <title>误差图</title>
</head>
<style>
    #container{
        width: 1200px;
        height: 600px;
        margin:0 auto;
    }

</style>
<body>
<div id="container"></div>
</body>
<script src="http://cdn.hcharts.cn/highcharts/highcharts.js"></script>
<script src="https://img.hcharts.cn/highcharts/highcharts-more.js"></script>
<script>
    var charts =new Highcharts.Chart('container',{
        chart: {
            zoomType: 'xy'
        },
        title: {
            text: '误差图'
        },
        xAxis: [{
            categories: ['一月', '二月', '三月', '四月', '五月', '六月', '七月', '八月', '九月', '十月', '十一月', '十二月']
        }],
        yAxis: [{ // Primary yAxis
            labels: {
                format: '{value} °C',
                style: {
                    color: Highcharts.getOptions().colors[1]
                }
            },
            title: {
                text: '温度',
                style: {
                    color: Highcharts.getOptions().colors[1]
                }
            }
        }, { // Secondary yAxis
            title: {
                text: '降水',
                style: {
                    color: Highcharts.getOptions().colors[0]
                }
            },
            labels: {
                format: '{value} mm',
                style: {
                    color: Highcharts.getOptions().colors[0]
                }
            },
            opposite: true
        }],
        tooltip: {
            shared: true
        },
        series: [{
            name: '降水',
            type: 'column',
            yAxis: 1,
            data: [49.9, 71.5, 106.4, 129.2, 144.0, 176.0, 135.6, 148.5, 216.4, 194.1, 95.6, 54.4],
            tooltip: {
                pointFormat: '<span style="font-weight: bold; color: {series.color}">{series.name}</span>: <b>{point.y:.1f} mm</b> '
            }
        }, {
            name: '降雨误差',
            type: 'errorbar',
            yAxis: 1,
            data: [[48, 51], [68, 73], [92, 110], [128, 136], [140, 150], [171, 179], [135, 143], [142, 149], [204, 220], [189, 199], [95, 110], [52, 56]],
            tooltip: {
                pointFormat: '(误差范围: {point.low}-{point.high} mm)<br/>'
            }
        }, {
            name: '温度',
            type: 'spline',
            data: [7.0, 6.9, 9.5, 14.5, 18.2, 21.5, 25.2, 26.5, 23.3, 18.3, 13.9, 9.6],
            tooltip: {
                pointFormat: '<span style="font-weight: bold; color: {series.color}">{series.name}</span>: <b>{point.y:.1f}°C</b> '
            }
        }, {
            name: '温度误差',
            type: 'errorbar',
            data: [[6, 8], [5.9, 7.6], [9.4, 10.4], [14.1, 15.9], [18.0, 20.1], [21.0, 24.0], [23.2, 25.3], [26.1, 27.8], [23.2, 23.9], [18.0, 21.1], [12.9, 14.0], [7.6, 10.0]],
            tooltip: {
                pointFormat: '(误差范围: {point.low}-{point.high}°C)<br/>'
            }
        }]


    });
</script>
</html>
漏斗图 - (funnel):
示例代码:
<!DOCTYPE html>
<html lang="en">
<head>
    <meta charset="UTF-8">
    <title>漏斗图</title>
</head>
<style>
    #container{
        width: 1000px;
        height: 600px;
        margin:0 auto;
    }

</style>
<body>
<div id="container"></div>
</body>
<script src="http://cdn.hcharts.cn/highcharts/highcharts.js"></script>
<script src="https://img.hcharts.cn/highcharts/modules/funnel.js"></script>
<script>
    var charts =new Highcharts.Chart('container',{
        chart: {
            type: 'funnel',
            marginRight: 100
        },
        title: {
            text: '销售漏斗',
            x: -50
        },
        plotOptions: {
            series: {
                dataLabels: {
                    enabled: true,
                    format: '<b>{point.name}</b> ({point.y:,.0f})',
                    color: 'black',
                    softConnector: true
                },
                neckWidth: '30%',
                neckHeight: '25%'
                //-- Other available options
                // height: pixels or percent
                // width: pixels or percent
            }
        },
        legend: {
            enabled: false
        },
        series: [{
            name: '用户',
            data: [
                ['访问网站',   15654],
                ['下载产品',       4064],
                ['询价', 1987],
                ['发送合同',    976],
                ['成交',    846]
            ]
        }]
    });
</script>
</html>
蜘蛛图:
示例代码:
<!DOCTYPE html>
<html lang="en">
<head>
    <meta charset="UTF-8">
    <title>蜘蛛图</title>
</head>
<style>
    #container{
        min-width: 400px;
        max-width: 600px;
        height: 400px;
        margin: 0 auto;
    }

</style>
<body>
<div id="container"></div>
</body>
<script src="http://cdn.hcharts.cn/highcharts/highcharts.js"></script>
<script src="https://img.hcharts.cn/highcharts/highcharts-more.js"></script>
<script>
    var charts =new Highcharts.Chart('container',{
        chart: {
            polar: true,
            type: 'line'
        },
        title: {
            text: '预算与支出',
            x: -80
        },
        pane: {
            size: '80%'
        },
        xAxis: {
            categories: ['销售', '市场营销', '发展', '客户支持',
                '信息技术', '行政管理'],
            tickmarkPlacement: 'on',
            lineWidth: 0
        },
        yAxis: {
            gridLineInterpolation: 'polygon',
            lineWidth: 0,
            min: 0
        },
        tooltip: {
            shared: true,
            pointFormat: '<span style="color:{series.color}">{series.name}: <b>${point.y:,.0f}</b><br/>'
        },
        legend: {
            align: 'right',
            verticalAlign: 'top',
            y: 70,
            layout: 'vertical'
        },
        series: [{
            name: '预算拨款',
            data: [43000, 19000, 60000, 35000, 17000, 10000],
            pointPlacement: 'on'
        }, {
            name: '实际支出',
            data: [50000, 39000, 42000, 31000, 26000, 14000],
            pointPlacement: 'on'
        }]
    });
</script>
</html>
极地图:
示例代码:
<!DOCTYPE html>
<html lang="en">
<head>
    <meta charset="UTF-8">
    <title>极地图</title>
</head>
<style>
    #container{
        min-width: 400px;
        max-width: 600px;
        height: 400px;
        margin: 0 auto;
    }

</style>
<body>
<div id="container"></div>
</body>
<script src="http://cdn.hcharts.cn/highcharts/highcharts.js"></script>
<script src="https://img.hcharts.cn/highcharts/highcharts-more.js"></script>
<script>
    var charts =new Highcharts.Chart('container',{
        chart: {
            polar: true
        },
        title: {
            text: '极地图'
        },
        pane: {
            startAngle: 0,
            endAngle: 360
        },
        xAxis: {
            tickInterval: 45,
            min: 0,
            max: 360,
            labels: {
                formatter: function () {
                    return this.value + '°';
                }
            }
        },
        yAxis: {
            min: 0
        },
        plotOptions: {
            series: {
                pointStart: 0,
                pointInterval: 45
            },
            column: {
                pointPadding: 0,
                groupPadding: 0
            }
        },
        series: [{
            type: 'column',
            name: '柱形',
            data: [8, 7, 6, 5, 4, 3, 2, 1],
            pointPlacement: 'between'
        }, {
            type: 'line',
            name: '线',
            data: [1, 2, 3, 4, 5, 6, 7, 8]
        }, {
            type: 'area',
            name: '面积',
            data: [1, 8, 2, 7, 3, 6, 4, 5]
        }]
    });
</script>
</html>